Working with R, it’s high likely you end with a table regarding to dichotomous variables in your datasets no matter the specific project you’re involved in. I like the ConfusionMatrix function from caret package, that calculates a cross-tabulation of observed and predicted classes. Here an example from caret vignette.
library(caret)

## 2 class example

lvs <- c(“normal”, “abnormal”)
truth <- factor(rep(lvs, times = c(86, 258)),
levels = rev(lvs))
pred <- factor(
c(rep(lvs, times = c(54, 32)), rep(lvs, times = c(27, 231))), levels = rev(lvs))
xtab <- table(pred, truth)
cm <- confusionMatrix(pred, truth)
cm$table
The confusion matrix renders as follows:
            Reference
Prediction abnormal normal
 abnormal     231     32
 normal        27     54
Taking this confusion table, simple and informative, but just figures. There’s a useful addition to your analysis using fourfoldplot from base R.
fourfoldplot(cm$table)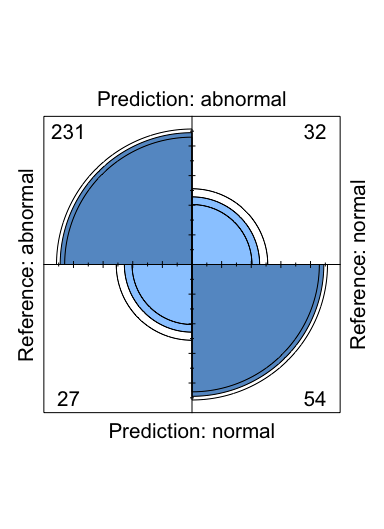
Pretty neat and a cool addition to your reproducible research to be shared.