Iris is one of the most used data set in R. We’ve seen it in many formats, and broadly used for data manipulation. You could say that there’s nothing new to learn if someone use Iris.
I was wondering if there’s something new, something never done to it before. Just a couple of clicks and found a way to have an interactive animated 3D chart. Just use the mouse pointer to drag and change perspective and move cube.
install.packages(“rgl”)
library(rgl)
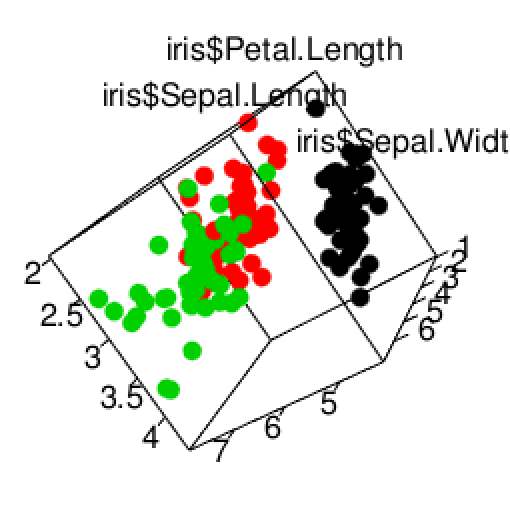
plot3d(iris$Sepal.Length, iris$Sepal.Width, iris$Petal.Length, type = “p”, col = as.numeric(iris$Species),size = 10)
play3d(spin3d(axis = c(0, 0, 1), rpm = 20), duration = 6)