When working on Machine Learning for classification and predictive models we tend to use the well known packages as randomforest, caret, xgboost, gbm and such.
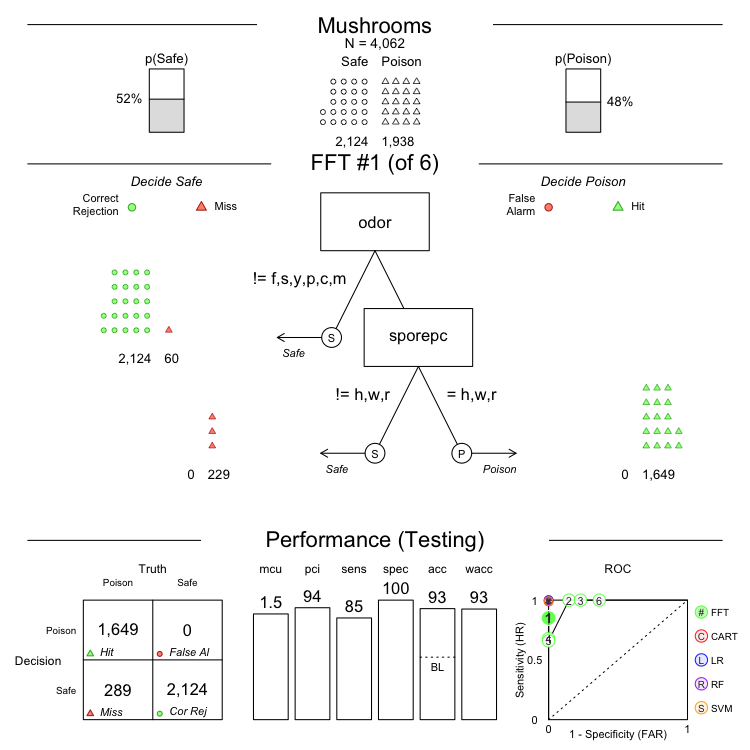
The issue is when the user needs explanation about how we get these results. The easy part is to explain a Tree. Pretty neat is you use the FFTrees package, that gives a cool output that needs a very short explanation.
When working with more complex algorithms we have no such option so you must work hard to understand what a SVM or GBM does. Sometimes it’s hard to explain even if you fully understood the intrincacies of the model. Sometimes the other part is not fully understanding what you say actually.
So my advice is to use tools to facilitate that work. Being a data scientist is not being obscure, right? You MUST help decision makers to fully understand your work.
Here my short list of packages versed on helping you with this “explain” processes. All of them outputs neat plots that helps a lot to explain and understand what is happenning under the hood. Variable importance charts, waterfall plots with variable contribution in predictions and such.
Behold, THE EXPLAINERS:
Please let me know if any other explainer package must be in this list (send me a Twitter DM).